These days, we are witnessing certain words – or entire phrases – making a dizzying career. In addition to slang phrases, such as ‘cringe’ (could there be anything more cringe than a brand trying to speak the language of youth?), much more serious terms are also becoming popular.
One such common phrase is ‘carbon footprint’. It appears most often in the context of environmental protection, but what exactly is it?
What is the carbon footprint?
Wikipedia says that the carbon footprint is: “the total greenhouse gas emissions caused by an individual, event, organisation, service, place or product, expressed as carbon dioxide equivalent (CO2e).” It includes not just CO2 but also methane and other greenhouse gases.
To put it in more human terms, it is the ecological footprint left by every human activity. Everything we do leaves its mark on the world around us!
It’s no different with products – their manufacturing and use also take their toll! Raw materials used in manufacturing, carbon dioxide emitted in transport, energy consumed at various stages of a product’s life – these are all real (and quantifiable) values.
However, manufacturers rarely state the ecological cost of their offerings. Communication is dominated by vague assurances of ‘carbon footprint reduction’ or ‘sustainability’, of which most often little follows. And yet, information about the environmental footprint of a product is key to making informed consumer decisions! It is also a waymark setting a course of action for truly responsible organisations.
The GoGreen policy
Here, at Perfecta we are responsible and take the environment very seriously. If you are interested in this topic, go ahead and read a post about our GoGreen policy, which we published some time ago.
In short, our GoGreen policy sets out our actions to reduce our environmental footprint. One of them is planning processes in such a way that they are as least disruptive to the planet as possible.
But to be able to effectively reduce the carbon footprint of our products, we first had to accurately determine it. That is why we decided to take a closer look at what kind of footprint our retail furniture leaves behind, and then consider how we can make it even friendlier.
Carbon footprint of the perfect.ONE tobacco products rack
And so, we have decided to take a closer look at one of our flagships and most technically advanced products, the CMS rack from the perfect.ONE tobacco rack system.
It is a modular system for displaying and selling tobacco products equipped with a 12V LED backlight and two 230V sockets. As the basis for our calculations, we used one module, which is a functional unit in its own right, and assumed that it would be in use for six years in the 18/7 system. The scope of the analysis, in turn, covers the entire life cycle of the product – from raw material extraction to disassembly and processing.
The rack that we used as a basis for our calculations is constructed from a number of materials, the contribution of which to the overall structure is best represented by a chart.
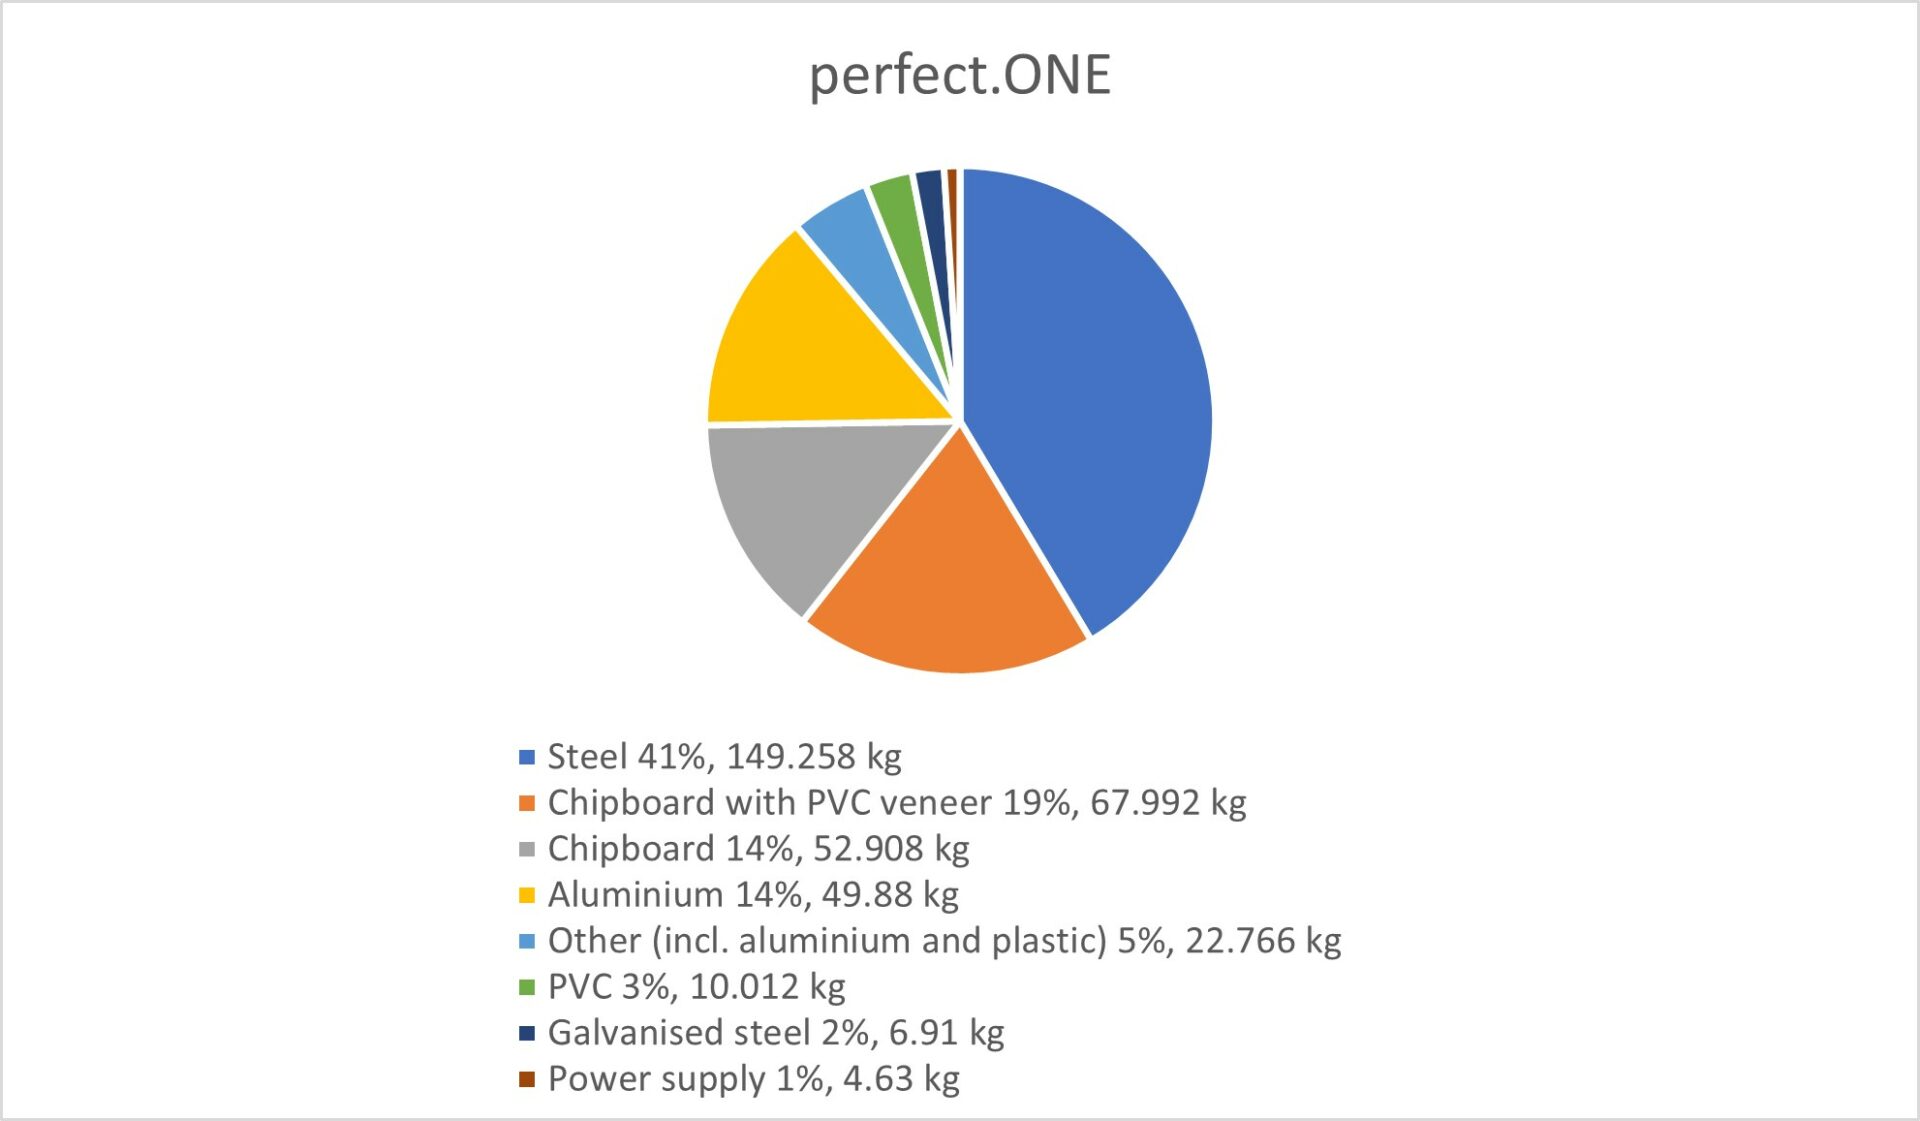
In order for our calculations to make sense, it was necessary to examine the carbon footprint t
hat each of these materials generates – from the extraction of raw materials, to processing into a finished product, to final recycling. This was not easy, because while we have access to detailed data for the production processes at Perfecta itself, we had to make several assumptions about the processes involved in the production and transport of raw materials, and the subsequent ecological costs of using the rack:
- The amount of generated waste was measured and is equal to 2% of aluminium profiles and 25% of used sheets.
- The transport distance between producers, distributors and the Perfecta company was estimated with Google Maps.
- For the components bought from China, the average transport distance was set at 1,000 km of rail transport and 20,000 km of marine transport or at 6,718 km of aircraft transport, if declared.
- For the components bought from Taiwan, the average transport distance was set at 20,000 km of marine transport.
- For the components bought from UAE, the average transport distance was set at 13,000 km of marine transport.
- As the car type was unknown for road transport, the carbon footprint of road transport was estimated with average carbon footprint for one tonne-kilometre in EU.
- In cases where multiple sources of intermediate goods were defined, the distance was averaged by the number of sources.
- In cases where the source of intermediate goods was defined as the European Union, the average transport was set at 1,000 km of road transport.
- In the case where the source of intermediate goods was defined as South Africa, the average transport was set at 500 km of rail transport.
- In case were multiple transport modes (especially marine and aircraft) were defined, the emission was averaged through number of transport modes.
- The final product is transported by road transport to the end customer.
- For rail, marine and aircraft transport the average CF per kilometre was used.
- The calculation of manufacturing was done with Polish electricity mix.
- The calculation of utilisation was done with the UK electricity mix.
Based on these assumptions, we made calculations which showed that the largest carbon footprint is generated by the sourcing of raw materials and the use of the finished furniture. A more detailed calculation is presented in the table below:
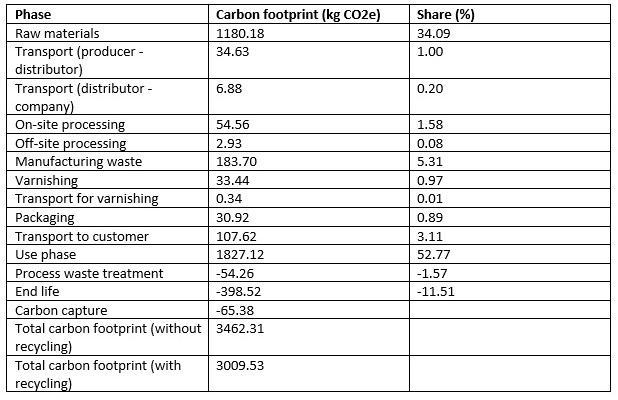
As you can see, the total carbon footprint that one perfect.ONE rack generates over 6 years is just over 3 tonnes of CO2! This is quite a good result, considering that one return flight between London and New York on a scheduled aircraft generates around 850 kg of CO2.
Further steps
But this does not satisfy us! By knowing which stages of our furniture’s life generate the largest footprint, we can now proceed to consciously reduce it! Now that we know that the production of steel and aluminium has a significant impact on the carbon footprint, we took measures to ‘slim down’ the rack design. Reducing the amount of metal in the overall design is possible and work is ongoing to replace it with components made from recycled materials where possible. It is also important to find component suppliers who can document the lowest possible carbon footprint of their products.
The next step – the step we are currently taking – is to modify the lighting system for our furniture. As we know, the use phase of a piece of furniture is the biggest generator of its carbon footprint: lighting running for 6 years for 18 hours each day can consume huge amounts of electricity!
That is why we are introducing Eco LED lighting in our designs, which uses 33% less energy while maintaining the same performance! In the case of the perfect.ONE rack, that’s as much as 600 kg less CO2 emitted!
These are all viable steps to reduce as much as possible the impact our activities have on the planet. Read more about how Perfecta is reducing its carbon footprint here: https://perfecta-retail.com/perfecta-operates-in-a-sustainable-way/